Quarterly/Monthly Condition Report
The Monthly condition report shows a list of all Maintenance routines, if they have been completed, their frequency, and who completed it. The quarterly condition report reveals the same information except that you can choose to view completed routines by quarters instead of months.
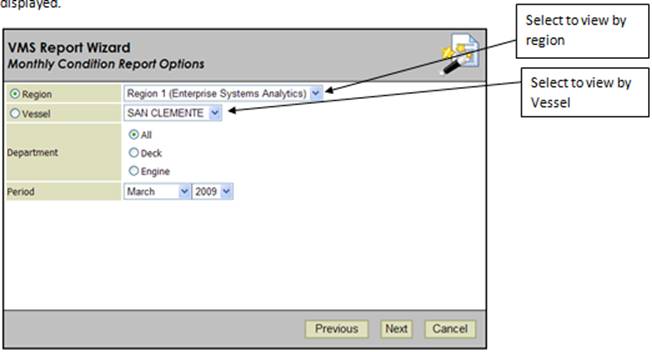
Upon selecting the monthly condition report in the reports section the following screen will be displayed.
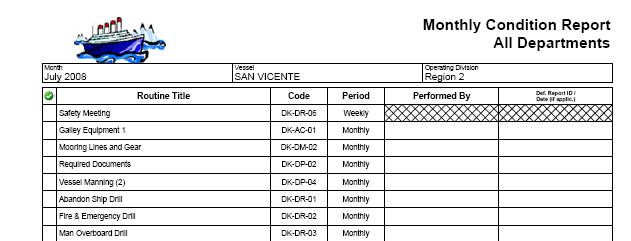
The following is an example of what the report would look like.
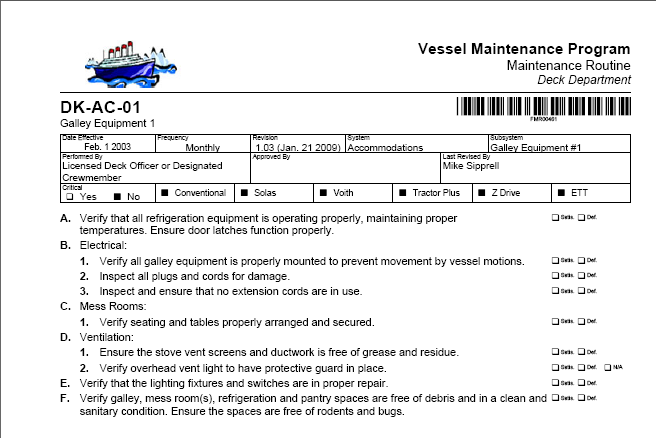
Maintenance Routines
The maintenance routine report displays either all company routines that have been entered into the system or just the routines associated with a certain vessel.
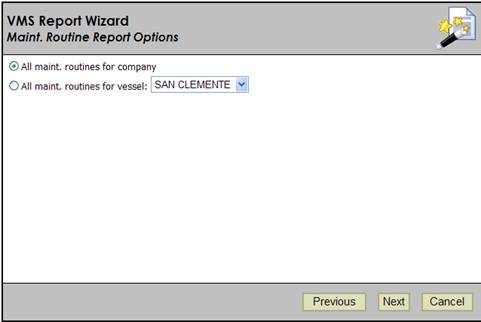
Upon selecting the maintenance routines report and clicking next you will be directed to the following screen. You can select to view all the maintenance routines for a company or a vessel. Both of these options combine all of the routines into one PDF document. Click next.
The following is an example of how one the MRs will be displayed.
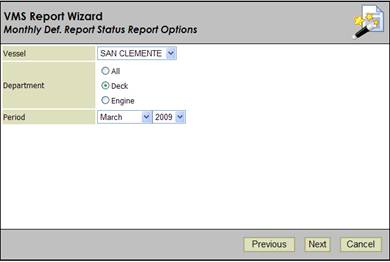
Month End Def. Report Status
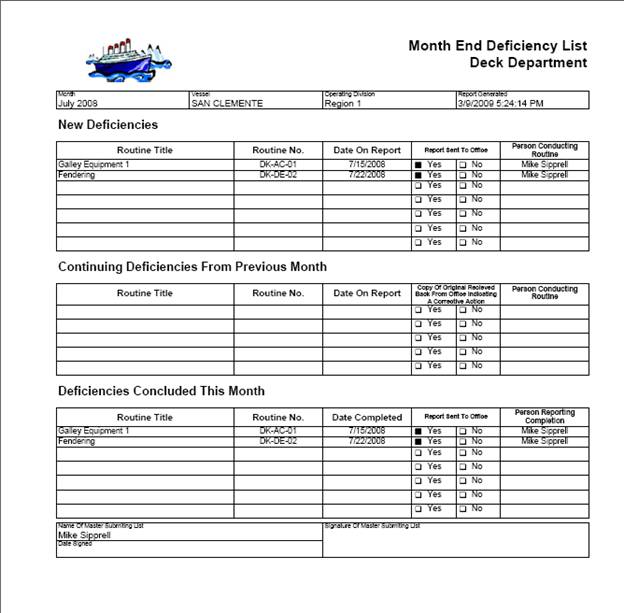
The Month End Def. Report details all new deficiencies, deficiencies that have been carried over from the previous month, and any deficiency that has been concluded during the selected month.
After selecting Month End Def. Report on the reports menu the following screen will be displayed. Select the vessel, department, and month you wish to view the deficiencies in.
This is preview of a month end deficiency report.
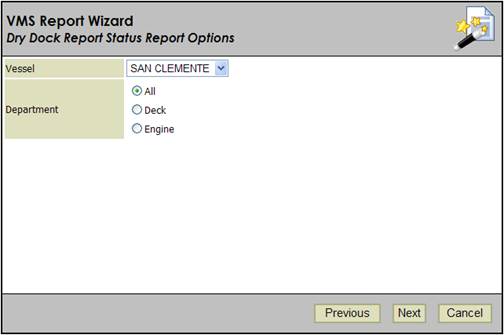
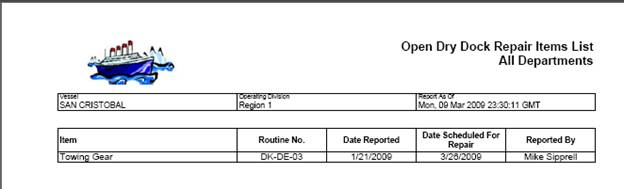
Items Scheduled for Dry Dock Repair
The Items Scheduled for Dry Dock Repair report displays by boat and department what items have been scheduled for drydock.
After Selecting the Items Scheduled for Dry Dock Repair Report the following screen will appear. Make your selections according to the boat and department you would like to view.
The following is a sample report.
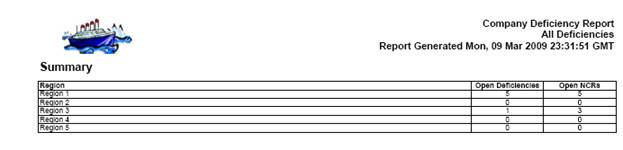
All Open Deficiencies Report
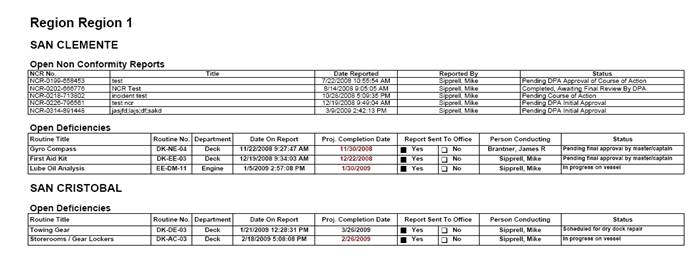
The All Open Deficiencies Reports displays all open deficiencies and NCR’s for a region and then for each boat within that region.
Example 1 is of the first page of the report, summarizing for each region how many deficiencies are open. Example two is an example of the rest of the report depicting details for each of the open DR’s and NCR’s.
Example 1:
Example 2: